In this tutorial the integration of the Grenton Smart Home system with Influx database and Grafana application is presented. This solution provides a possibility to the data collection and the visualization of the collected information.
Requirements
- CLU Z-Wave 2.0 - named CLU_ZWAVE_2
- Gate HTTP - named CLU_GATE_HTTP
- Server with InfluxDB instance and Grafana application
- Smart Panel or other sensors providing data
Preparing the server on the Raspberry Pi
- Installing Rasbian on Rasberry Pi
- Download the installer https://www.raspberrypi.org/downloads/
- Upload system to SD card
- Start and configure network connection, users
- Installing InfluxDB (use command line for commands) 3. wget -qO- https://repos.influxdata.com/influxdb.key | sudo apt-key add - 2. echo "deb https://repos.influxdata.com/debian buster stable" | sudo tee /etc/apt/sources.list.d/influxdb.list 3. sudo apt-get update 4. sudo apt-get install influxdb
- Configuring InfluxDB as a service to turn on automatically
- sudo systemctl unmask influxdb
- sudo systemctl enable influxdb
- sudo systemctl start influxdb (InfluxDB Server Startup)
- type influx into the CLI
- then create the database CREATE DATABASE grenton
- exit the Influx CLI by typing exit
- Installing Grafana
- sudo apt-get install -y adduser libfontconfig1
- wget https://dl.grafana.com/oss/release/grafana_7.2.0_armhf.deb
- sudo dpkg -i grafana_7.2.0_armhf.deb
- Configuring and commissioning Grafana
- sudo systemctl enable grafana-server
- sudo systemctl start grafana-server
Useful commands when using influx
SHOW DATABASES - shows the created databases
USE grenton - selects a database named grenton to use
SHOW MEASUREMENTS - shows which measurements are stored in the selected database
SHOW FIELD KEYS - shows which key fields are stored in the selected database
SELECT COUNT(*) FROM temp - counts all records from all fields in the measurement named temp
SELECT * FROM temp - displays all data for the temp measurement
For more information, see the official documentation:
https://docs.influxdata.com/influxdb/v1.8/write_protocols/line_protocol_reference/..
Configuration of the Grenton system
In order to transfer sensor’s data and events from the Grenton system to the Influx database, the web API is used. For this purpose, you need to create a HttpRequest virtual objects on the Gate HTTP module.
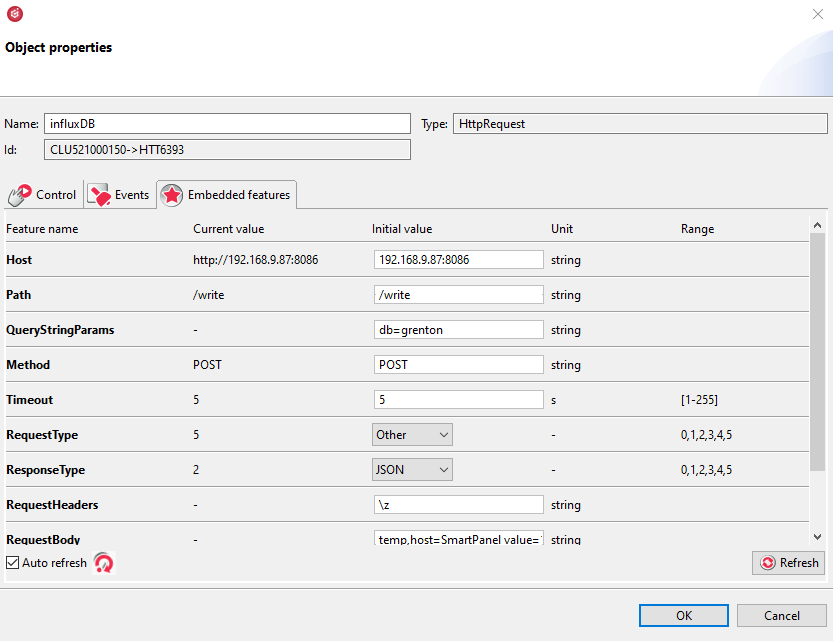
- Create the HttpRequest virtual object. In the example we will call it influxDB.
- Configure the Embedded features as follows:
- Host - http://ip_address:8086
- Path - /write
- QueryStringParams - db=name_of_database (grenton in the example)
- Method - POST
- RequestType - Other
- ResponseType - JSON
- The rest of features are left as default

Next, create a script that will store temperature readings from the Smart Panel sensor in the InfluxDB - grenton database.
local body = "temp,host=SmartPanel value=" .. CLU_ZWAVE_2->PANELSENSTEMP1->Value
local qs = "db=grenton"

CLU_GATE_HTTP->influxDB->SetRequestBody(body)
CLU_GATE_HTTP->influxDB->SetQueryStringParams(qs)
CLU_GATE_HTTP->influxDB->SetMethod("POST")
CLU_GATE_HTTP->influxDB->SendRequest()
Go to the PANELSENSTEMP1 object representing the temperature sensor and the OnValueChange event . As a result, any temperature change will be written to the InfluxDB grenton database. Note the Threshold embedded feature of the Smart Panel sensors. The smaller the value, the more frequently the data will be written to the Influx database.
If you want to have regular readings stored in the database, you should replace the script calling by the OnValueChange event by using the Timer virtual object that you configure:
- Set the Mode embedded feature to Interval
- The Time embedded feature is used to specify how often it should be written. For example, every 10.000 milliseconds
To the OnInit event of CLU_GATE_HTTP (where the Timer object is), add a call to the Start method of the Timer object to update the database every specified time.
Note
Pay attention to the frequency of writes. The Raspberry Pi uses an SD card and writing too frequently can lead to the card damages faster.
This is an example without authorization. If you enable authorization in Grafana then modify the line in the script:
local qs = "db=grenton&u=username&p=password"
Configuration of the Grafana application
We connect to Grafana using the web browser http://adres_serwera:3000.
By default, logging in with the account admin and password admin. During the first login the application will force the user to change the password.
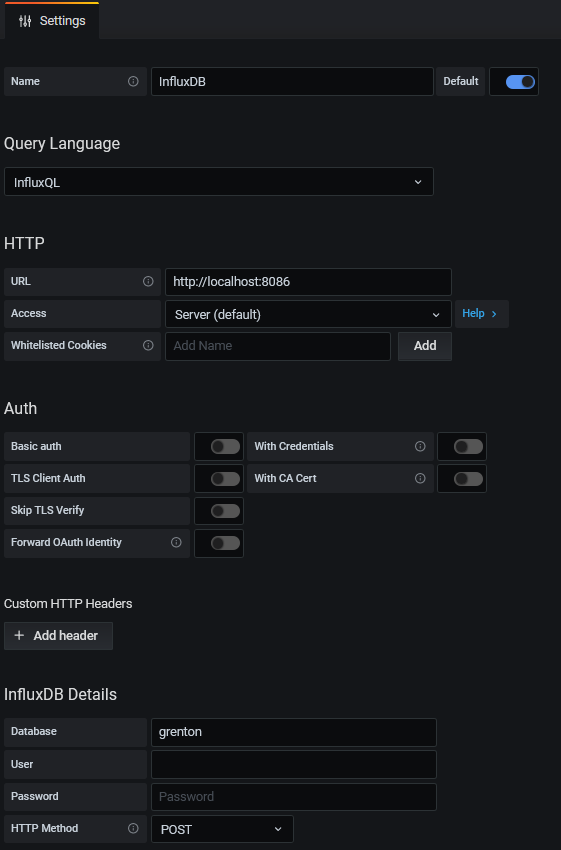
Next, configure the connection with Influx database
Configuration > Data Sources > Add data source
URL: http://localhost:8086 (in the example, Grafana is on the same server as InfluxDB)
Database: grenton (name of our database)
Http Method: POST
Configuring the connection between Grafana and Influx:

In the next step, create a Dashboard. In the menu on the left, click the plus, this will create a new Dashboard. Next, add the dashboard and proceed to configure it. Select the Influx database and indicate which measurement you are interested in (temp in the example). 
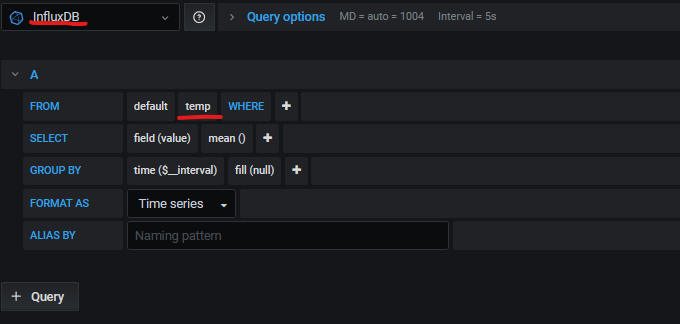
Grafana offers a wide range of diagram configuration options.